Seamless Data Import
Just import your test results and we'll extract every measurement instantly — no data entry needed.
Works With Any Provider
Compatible with test results from Quest, LabCorp, your local clinic, and beyond.
Clear Visual Tracking
See your results in easy-to-understand charts and track changes over time at a glance.
How It Works
1. Import Test Results
Import blood test results from any provider. We accept PDFs and screenshots.
2. Automatic Extraction
Biotracker automatically extracts all the measurements from your blood test results, eliminating manual data entry.
3. View Your Dashboard
See all your results in clear, interactive charts and track changes over time. Try the demo below.
Secure & Private
Secure Transmission
All data is fully encrypted during transmission between your device and our servers in both directions.
Local Storage
The extracted medical data is stored only on your device. No medical data is stored on our servers.
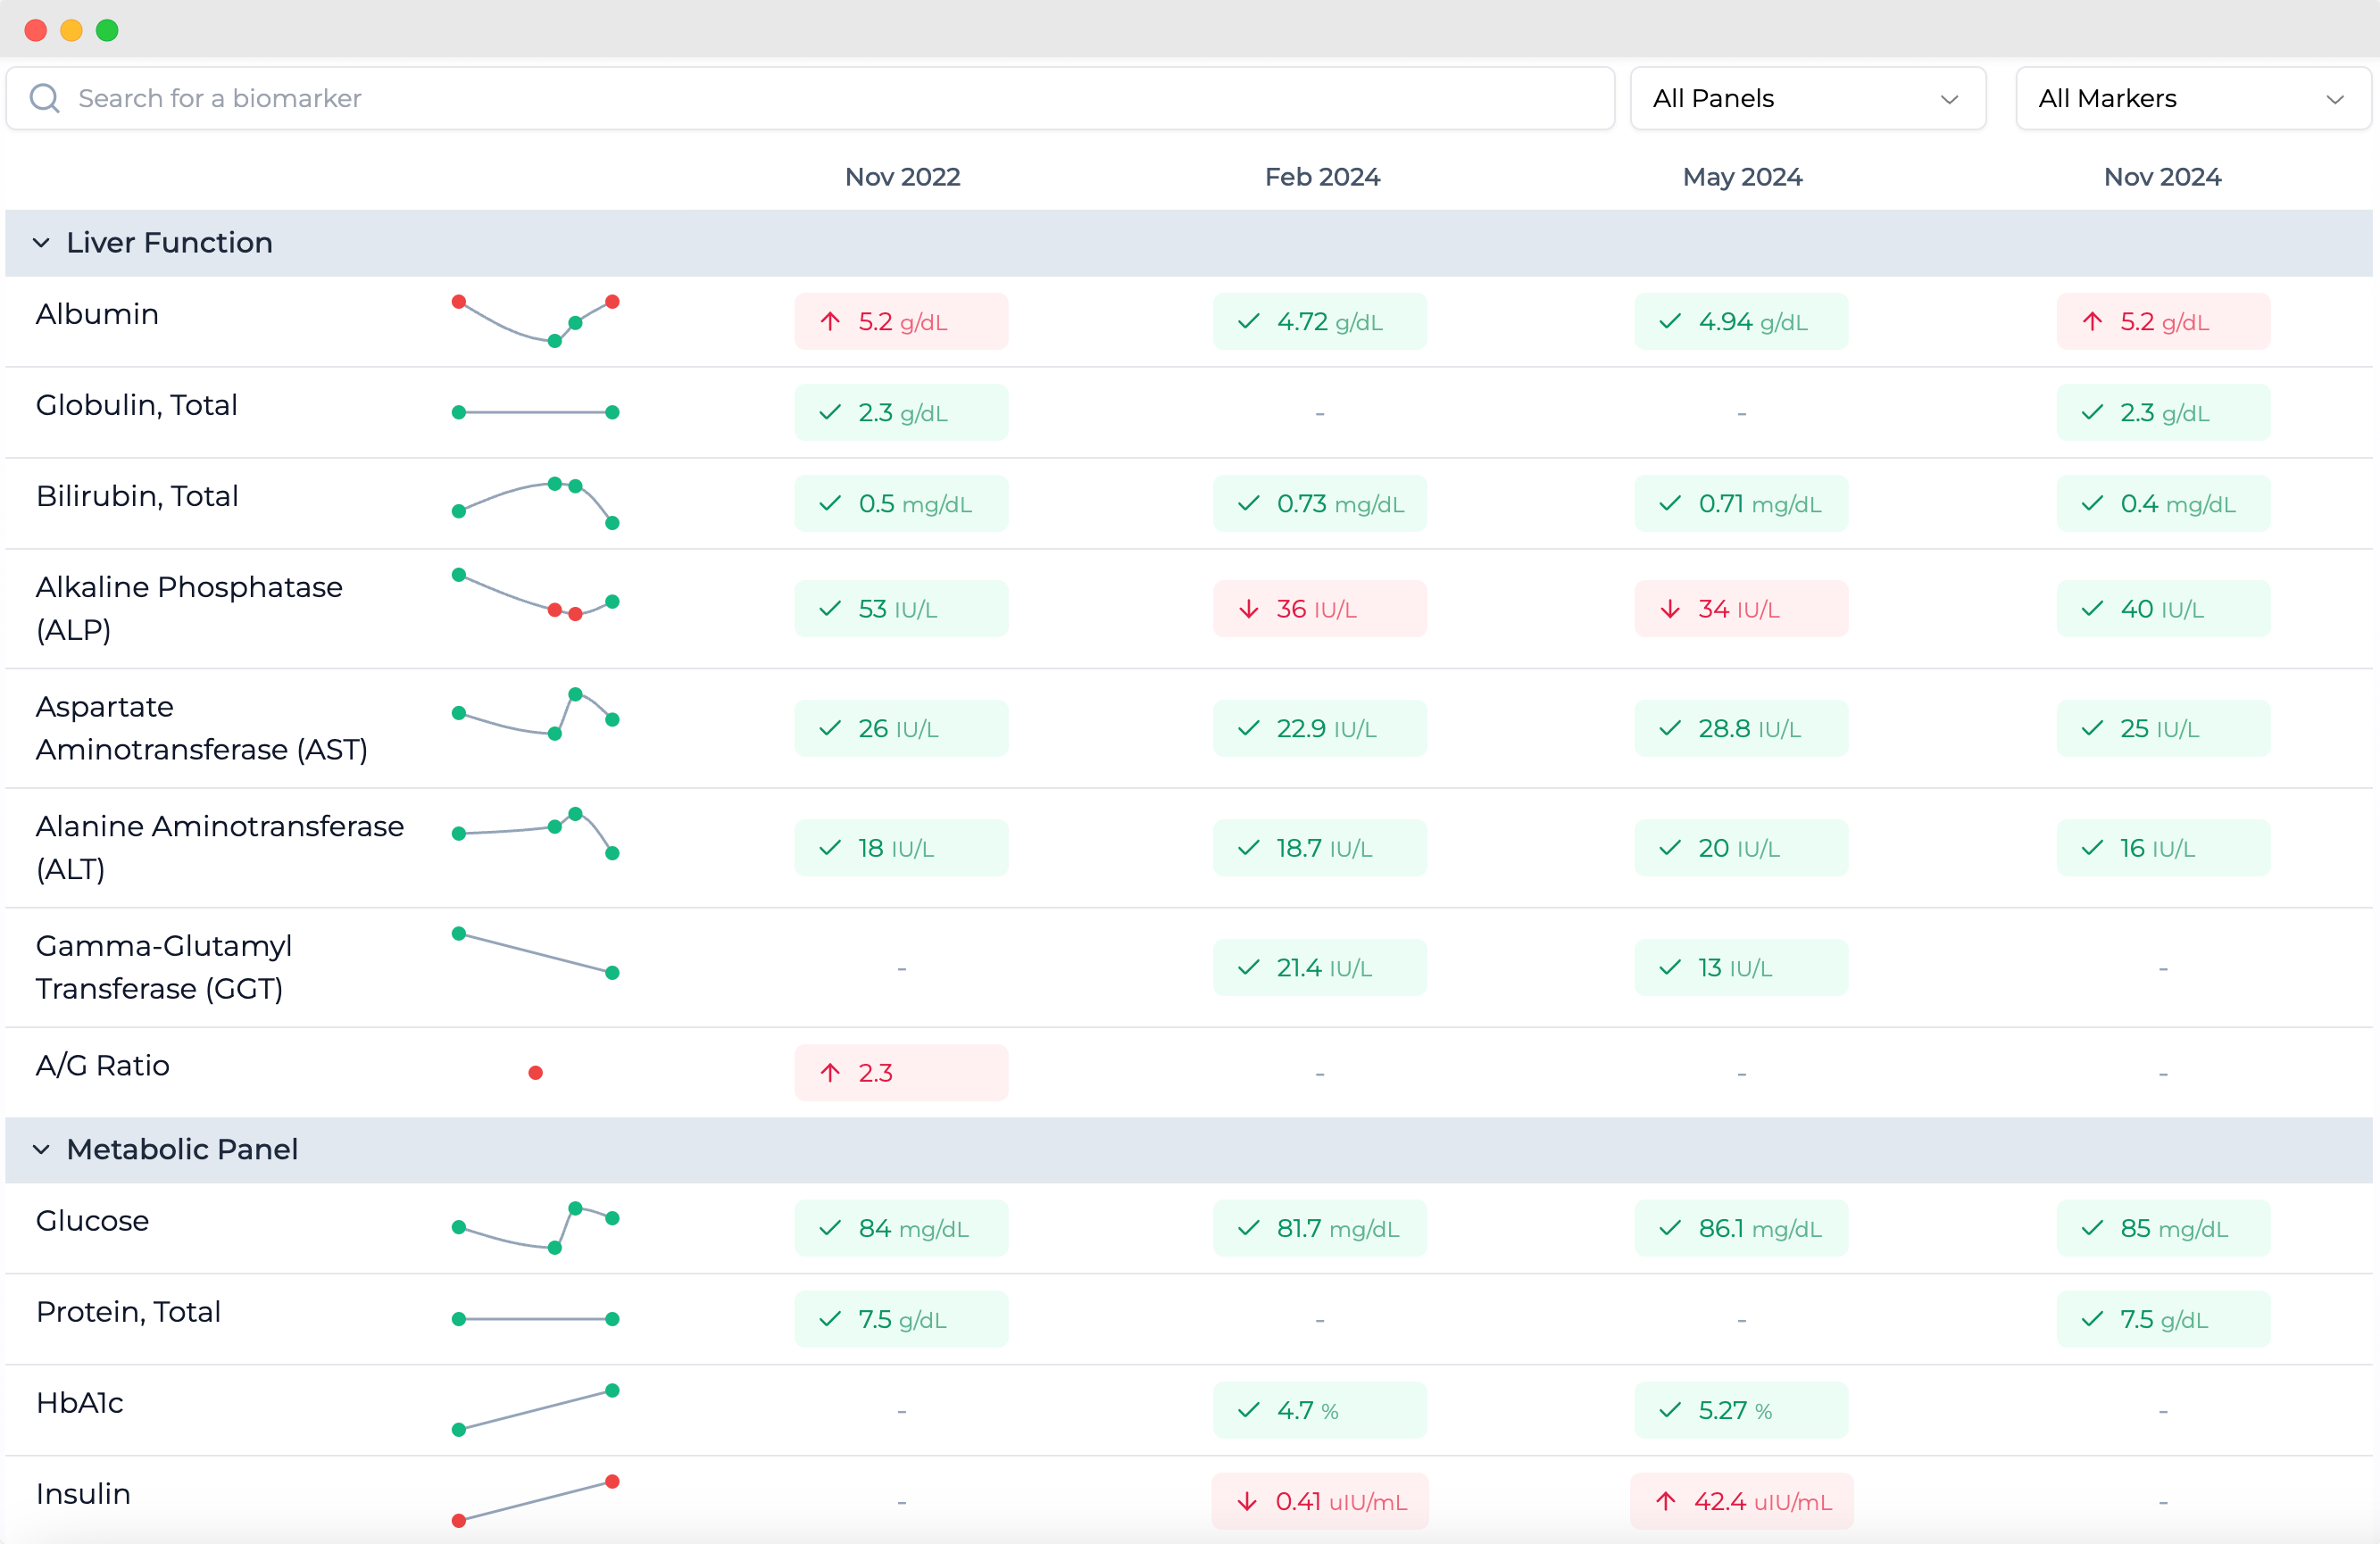
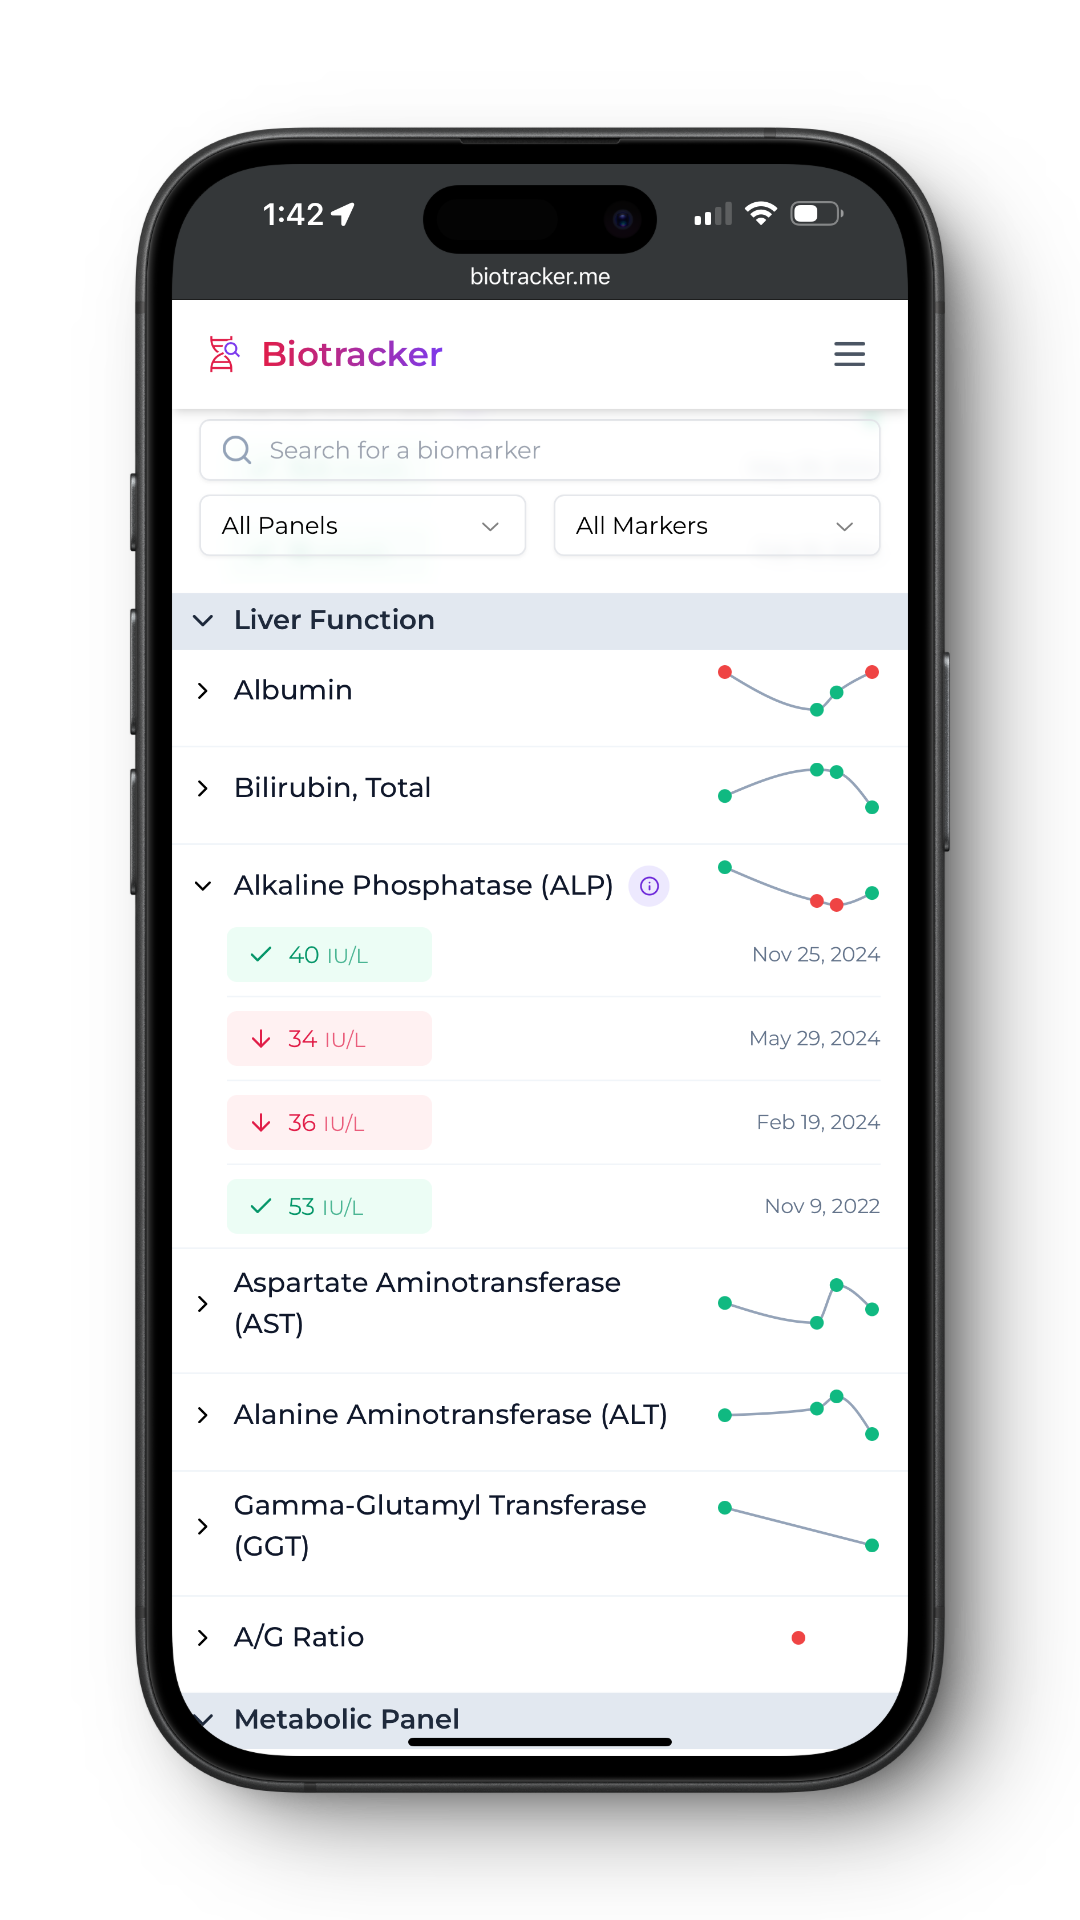
Health Dashboard Demo
Play with a live, interactive health dashboard using sample data. Filter biomarkers, explore trends, and see how your future dashboard will look once you import your blood test results.
Insights
- Your Triglycerides have significantly improved from 192 to 140 mg/dL, showing good progress.
- Your HDL Cholesterol has increased from 42 to 48 mg/dL, moving into a healthier range.
- Your Total Cholesterol has improved from 175 to 168 mg/dL, trending in the right direction.
- Your Vitamin D levels have significantly improved from 22 to 42 ng/mL over the past year.
- Your HbA1c has improved from 6.0% to 5.2%, indicating better blood sugar control.
These insights are generated based on your biomarker data and are for informational purposes only. Always consult with your healthcare provider before making any changes to your health routine.
Complete Blood Count | |||||
Basophil Count | 010^3/µL | 010^3/µL | 0.0810^3/µL | 0.1210^3/µL | |
Eosinophil Count | 0.110^3/µL | 0.110^3/µL | 0.1210^3/µL | 0.2810^3/µL | |
Hematocrit (HCT) | 44.6% | 44.2% | 43.2% | 44.8% | |
Hemoglobin (Hgb) | 15.2g/dL | 14.7g/dL | 14.3g/dL | 14.8g/dL | |
Lymphocyte Count | 1.310^3/µL | 1.510^3/µL | 2.5110^3/µL | 3.210^3/µL | |
Monocyte Count | 0.310^3/µL | 0.410^3/µL | 0.4610^3/µL | 0.810^3/µL | |
Neutrophil Count | 3.410^3/µL | 4.310^3/µL | 2.2910^3/µL | 7.610^3/µL | |
Red Blood Cells (RBC) | 5.1410^6/µL | 4.9310^6/µL | 4.8510^6/µL | 4.9410^6/µL | |
White Blood Cells (WBC) | 5.110^3/µL | 6.310^3/µL | 5.4710^3/µL | 1210^3/µL | |
Lipid Panel | |||||
Apolipoprotein B (ApoB) | 100mg/dL | 101mg/dL | 98mg/dL | 85mg/dL | |
Cholesterol, Total | 225mg/dL | 195mg/dL | 175mg/dL | 168mg/dL | |
HDL Cholesterol | 46mg/dL | 44mg/dL | 42mg/dL | 48mg/dL | |
LDL Cholesterol | 148mg/dL | 118mg/dL | 95mg/dL | 92mg/dL | |
Triglycerides | 155mg/dL | 165mg/dL | 192mg/dL | 140mg/dL | |
Metabolic Panel | |||||
Glucose | 112mg/dL | 108mg/dL | 92mg/dL | 85mg/dL | |
HbA1c | 6% | 5.8% | 5.4% | 5.2% | |
Insulin | 16.8uIU/mL | 14.2uIU/mL | 8.9uIU/mL | 6.8uIU/mL | |
Vitamin Panel | |||||
Vitamin B12 | 245pg/mL | 210pg/mL | 180pg/mL | 285pg/mL | |
Vitamin D, 25 Hydroxy | 22ng/mL | 32ng/mL | 45ng/mL | 42ng/mL | |